
Linking Process to Performance
A Guide to Effective OKRs

From KPIs to OKRs: Evolution in Performance Measurement
One of the many (many, many, many, many, many) core responsibilities for Finance teams is connecting human behavior to numerical performance metrics. While Key Performance Indicators (KPIs) have traditionally served as our measuring stick, Objectives and Key Results (OKRs) represent an evolution in how we approach performance measurement and management.
Understanding the Basics: KPIs vs. OKRs
KPIs tell the story behind your business results. Take sales, for instance: traditional KPIs might focus on quantity sold and price points. These metrics provide valuable insights, but OKRs take this framework a step further by creating actionable, measurable objectives tied to specific outcomes.
Building Effective OKRs: A Practical Example
Let's break down how to structure OKRs using a sales growth scenario:
Objective: Increase overall sales volume
Key Result 1: Enter and establish presence in new territory X
Key Result 2: Generate Y units of sales volume from new territory
What makes this OKR structure powerful is its measurability and direct attribution. Success or failure becomes clearly visible: either we see orders flowing from the new territory, or we don't.
We’ve also connected upstream behavior (our ability to penetrate a new market) with direct downstream business results (Sales on the P&L).
The Process-First Approach
Before implementing OKRs, it's crucial to have a solid operational foundation. This means:
Understanding all process ingredients and components
Understand all process ingredients and components
Nothing can be measured or attributed to results if we don't first develop a thorough understanding of the underlying process and its fundamental components. Without this crucial foundation, any attempt to measure performance or establish accountability becomes an exercise in futility. I talk about this at length in a previous post. Process is first, always - it forms the bedrock upon which all meaningful metrics and measurements must be built.
How many prospects need to be contacted to generate a sale? What is the typical conversion rate at each stage of the funnel? What factors influence these conversion rates?
Identify which variables we can and cannot influence
Now that we know how the process flows, we can determine which process ingredients we can influence, and which ones we cannot. We can influence how many prospects we contact, we need to make sure we are bringing prospects in and establish goals around how many and how quickly we contact them.
We cannot influence the fact that market conditions are currently forcing a particular prospect out of business because their factory burned down.
An extreme example, but it shows that our focus should be on prospect volume, not limiting the number of textile factories that burn down monthly.
Map how these elements interact within the broader business operation
Finally, we can map these variables to the broader process that drives the business operation:
Our conversion rate is 5%
If we contact 100 prospects, 5 of them will become customers
Avg Sales per customer is $50
Bottom Line: For every 100 prospects contacted, we can generate $250 in incremental sales.
Creating a Working Model
Once we understand our process and its components, we can develop OKRs that:
Target specific, controllable variables—prospects in new territory X
Connect directly to measurable outcomes—number of prospects contacted
Drive desired behavioral changes—sales team must contact 100 prospects per month
Support overall business objectives—5 × $50 × 12 months = $3,000 in annual incremental sales
This creates a cohesive strategy that drives toward an executive-level goal (increased sales) and makes it tangible and measurable at a tactical level (did we contact the right number of prospects this month).
Now What?
Now it's time to execute and measure the results. Here's what we need:
An efficient (ideally automated) data source to track the number of prospects contacted in territory X by date
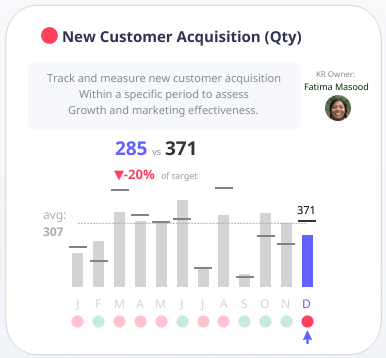
A simple visualization that clearly shows whether we've hit our target
A regular check-in schedule to review our progress and engage with key personnel to understand why we're hitting or missing our targets
There is a wonderful data visualization example on Tableau Public from Nir Smilga that shows what this looks like in practice.